golang pprof
Alex 4/3/2023 golang
# 开启 pprof
相当于导入了 pprof 的 init 函数,由于导入是深度优先原则,所以 pprof 的 init 会被先执行,后续当前包内的 init 函数执行后会为其建立 http 监听。
package main

import (
	"net/http"
	_ "net/http/pprof"
)

func init() {
	go func() {
		_ = http.ListenAndServe("127.0.0.1:5002", nil)
	}()
}
1
2
3
4
5
6
7
8
9
10
11
12
2
3
4
5
6
7
8
9
10
11
12
net/http/pprof 包的 init,注册了5个路由
func init() {
http.HandleFunc("/debug/pprof/", Index)
http.HandleFunc("/debug/pprof/cmdline", Cmdline)
http.HandleFunc("/debug/pprof/profile", Profile)
http.HandleFunc("/debug/pprof/symbol", Symbol)
http.HandleFunc("/debug/pprof/trace", Trace)
}
1
2
3
4
5
6
7
2
3
4
5
6
7
锁和阻塞的追踪默认关闭,需要手动开启
runtime.SetBlockProfileRate(1)
runtime.SetMutexProfileFraction(1)
1
2
2
# 获取数据
打开 http://127.0.0.1:5002/debug/pprof/ 即可查看可追踪项目
- allocs: 过去内存分配样本
- block: 查看导致阻塞同步的堆栈跟踪
- cmdline: 程序启动的完整命令行
- goroutine: 当前运行的所有协程的堆栈跟踪
- heap: 活动对象的内存分配
- mutex: 互斥锁竞争的栈跟踪。
- profile: 获取 30 秒的 CPU Profile
- threadcreate: 系统线程的堆栈跟踪
- trace: 执行情况辅助跟踪

以 goroutine 为例,url 为 http://127.0.0.1:5002/debug/pprof/goroutine?debug=1, 与源码中注册的路由一致。
# 获取离线堆栈跟踪数据
默认为网页展示模式,我们也可以去掉 url 中 ?debug=1 来访问,将会得到一个文件。

除了直接在页面上点击下载之外,还有两种方法可以将堆栈情况保存到本地,在其他地方进行分析
curl -o cpu.profile http://127.0.0.1:5002/debug/pprof/profile?seconds=30
1
文件存储在 ~/pprof/pprof.___769RUN.alloc_objects.alloc_space.inuse_objects.inuse_space.001.pb.gz
go tool pprof --seconds 30 http://127.0.0.1:5002/debug/pprof/profile
1
# 交互式堆栈跟踪
刚才得到的三种文件都可以用于堆栈跟踪,,可用如下命令进行交互式分析
- help 帮助
- top 查看前10个的CPU使用情况
- tree 以树状显示
- png 以图片格式输出
- svg 生成 svg 图片
go tool pprof goroutine
1
或
go tool pprof cpu.profile
1
或
go tool pprof pprof.featureservice.samples.cpu.001.pb.gz
1
如果监听了公网,则也可以直接分析远程文件
go tool pprof http://127.0.0.1:5002/debug/pprof/goroutine
1
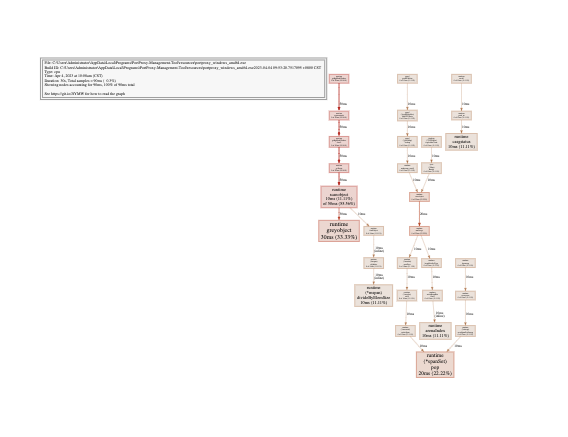
# 图形化堆栈跟踪
图形化同样支持以上三种文件
生成 svg 图像
go tool pprof -svg goroutine >goroutine.svg
1
打开 web 网站进行图形化查看
go tool pprof --http=:5002 goroutine
1
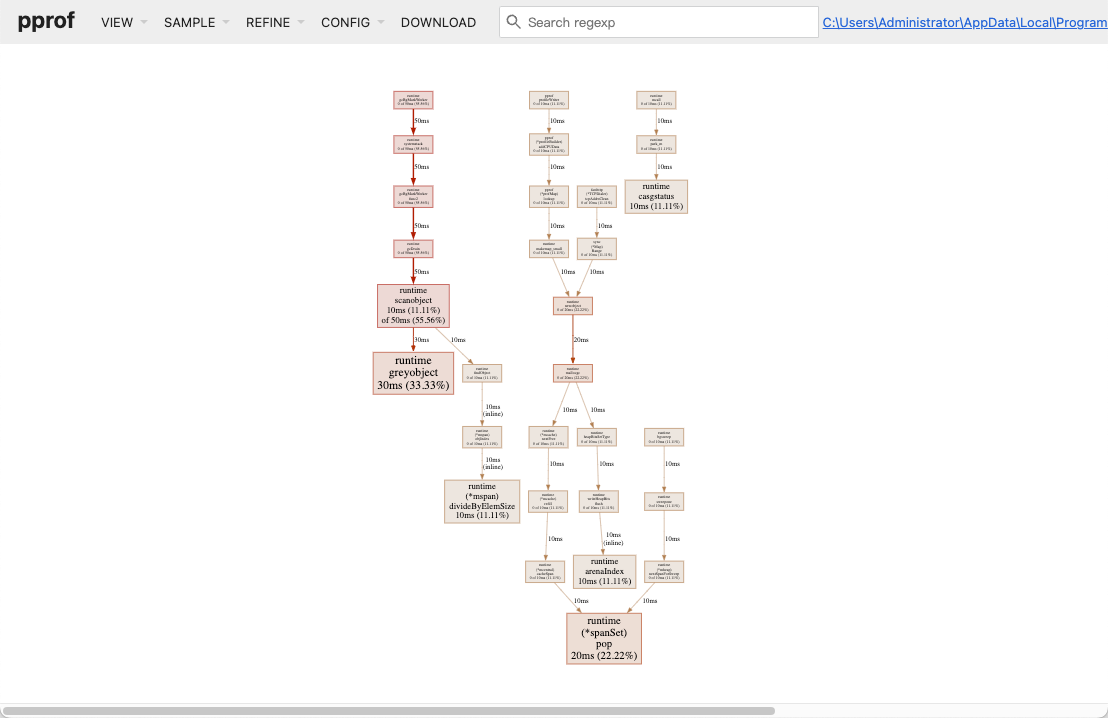
如果监听了公网,则也可以直接分析远程文件
go tool pprof --http=:5002 http://127.0.0.1:5002/debug/pprof/goroutine
1
默认捕获30s数据,修改捕获时间
go tool pprof --http=:5002 --seconds 10 http://127.0.0.1:5002/debug/pprof/allocs
1
# Trace
值得注意的是 trace 并不是用 pprof 进行分析,而是使用 trace
go tool trace profile.trace
1
# 捕获堆栈跟踪数据脚本
rm -rf profiles || true
mkdir profiles && cd profiles

curl -o profile.allocs "http://127.0.0.1:5002/debug/pprof/allocs?seconds=30" &
curl -o profile.block "http://127.0.0.1:5002/debug/pprof/block?seconds=30" &
curl -o profile.cmdline "http://127.0.0.1:5002/debug/pprof/cmdline?seconds=30" &
curl -o profile.goroutine "http://127.0.0.1:5002/debug/pprof/goroutine?seconds=30" &
curl -o profile.heap "http://127.0.0.1:5002/debug/pprof/heap?seconds=30" &
curl -o profile.mutex "http://127.0.0.1:5002/debug/pprof/mutex?seconds=30" &
curl -o profile.profile "http://127.0.0.1:5002/debug/pprof/profile?seconds=30" &
curl -o profile.threadcreate "http://127.0.0.1:5002/debug/pprof/threadcreate?seconds=30" &
curl -o profile.trace "http://127.0.0.1:5002/debug/pprof/trace?seconds=30" &
1
2
3
4
5
6
7
8
9
10
11
12
2
3
4
5
6
7
8
9
10
11
12